
Five 643 Tools for Postseason Prep
Postseason games are some of the most high-stakes in any team’s season, where every pitch, swing, and decision can determine whether you go home for the summer or live to play another day. In these pressure-packed environments, preparation is everything. That’s why having all your scouting data, matchup histories, and performance analytics organized and easily accessible is crucial. With that in mind, here are five 6-4-3 Charts’ tools to help coaches and players prepare for postseason play!
Player vs. Player: Your Go-To Historical Matchup Tool
The Player vs. Player tool allows you to compare your players’ performance against any opposing player throughout their careers. Coaches can gain valuable insights:
- Pitching coaches can analyze how the opponent’s lineup performed against their pitchers;
- Hitting coaches can review past stats and video to adjust hitters’ strategies accordingly; and
- Head coaches can use all the information to inform critical late-game substitutions!
Below are a few suggested use cases for Player vs. Player while preparing for the postseason play! 👇

Matchup PDF Exports for Quick Reference
Generate and print PDF matchup sheets showing historical performance between your team and opponents for quick in-game reference.
These can be particularly useful in the dugout during postseason games, when you may not have seen a certain player for a month or two (or at all).

Historical Matchup Analysis + Synergy Video
Quickly see how your hitters have historically performed against specific pitchers in your conference over multiple seasons. (Or how your pitchers have performed against specific hitters!)
This data can inform lineup decisions, but it could be especially valuable in late-game postseason situations when deciding whether to pinch-hit against a new reliever.
Video Playlists of Previous At-Bats
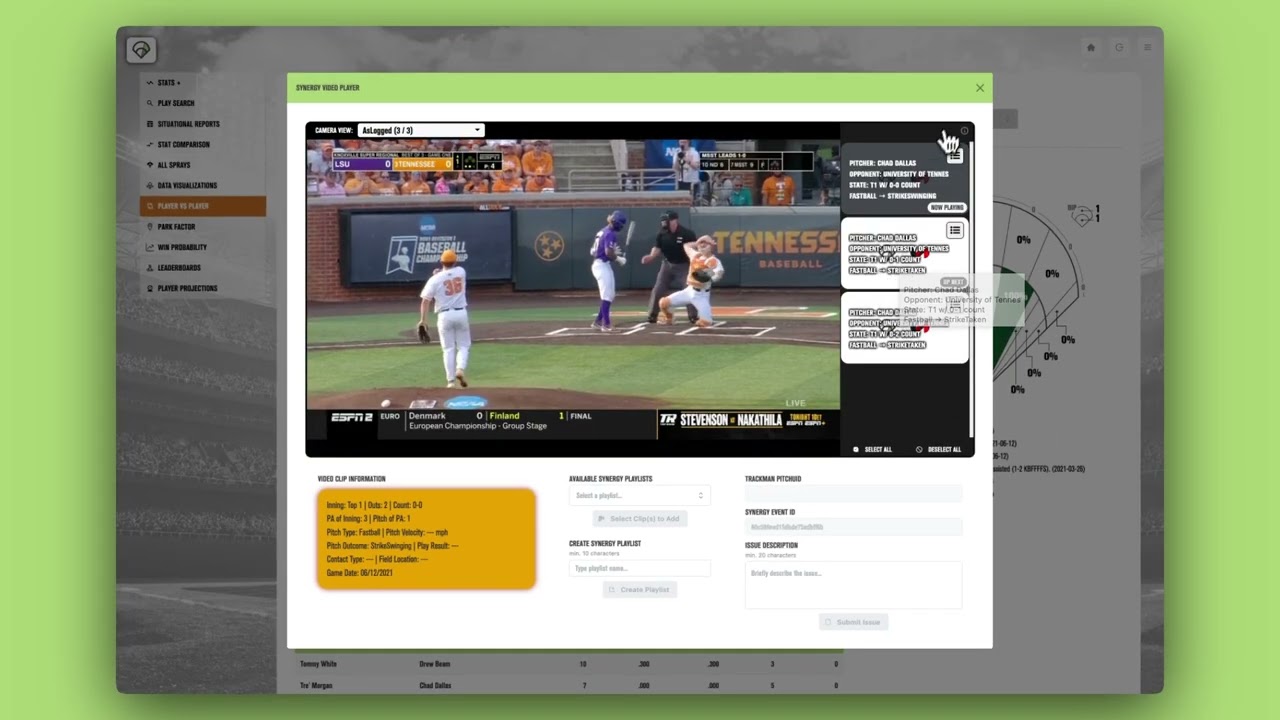
Create video playlists of previous matchups between your pitchers and the opponent’s key hitters.
Using our 643 Synergy integration, you can show your hitters* exactly how they’ve approached specific pitchers in the past, what worked, and what didn’t, helping them mentally prepare for high-stakes postseason encounters.
(*and pitchers vs hitters!)

- PDF Exports for Quick Reference
-
Matchup PDF Exports for Quick Reference
Generate and print PDF matchup sheets showing historical performance between your team and opponents for quick in-game reference.
These can be particularly useful in the dugout during postseason games, when you may not have seen a certain player for a month or two (or at all).
- Historical Matchup Analysis
-
Historical Matchup Analysis + Synergy Video
Quickly see how your hitters have historically performed against specific pitchers in your conference over multiple seasons. (Or how your pitchers have performed against specific hitters!)
This data can inform lineup decisions, but it could be especially valuable in late-game postseason situations when deciding whether to pinch-hit against a new reliever.
- Matchup Video Playlists
-
Video Playlists of Previous At-Bats
Create video playlists of previous matchups between your pitchers and the opponent’s key hitters.
Using our 643 Synergy integration, you can show your hitters* exactly how they’ve approached specific pitchers in the past, what worked, and what didn’t, helping them mentally prepare for high-stakes postseason encounters.
(*and pitchers vs hitters!)
Short Game: Small Ball Wins Big Games
The Short Game tool provides coaches with Synergy-connected data tables for all the short game categories: Bunting, Base-Stealing, Pickoffs, and Slapping.
Utilize the Short Game tool as you gear up for the postseason. Discover your opponent’s small ball tendencies—this extra preparation might just give you the edge to anticipate a squeeze play or surprise with a second-to-third steal.
Below are a few suggested use cases for the Short Game tool while preparing for the postseason play! 👇

The Who, What, When, & Where of Bunting
Some teams bunt a lot, and if you’re not prepared, it could cost you valuable outs. The Bunting section in the Short Game tool allows you to analyze:
- Who bunts the most/least?
- What kind of bunts are they dropping?
- When in an AB/inning do they bunt most/least?
- Where on the field are the bunts being directed?

A Catcher’s Throws
The Short Game tool’s Base-Running section will help you figure out if there are any advantages to running on a catcher in specific counts or certain base states. Plus, you can view all associated Synergy video of the throws.
Having all this historical data and video in one place will help you develop a better feel of if and when you want to attempt a steal.

Pickoff Attempts
Have you looked at opposing pitchers’ pickoff attempts by count? If you haven’t, it could be the edge you need in the postseason to get the jump on opposing pitchers.
Scroll down to the Short Game tool’s Pickoff section to see which counts a pitcher has historically made pickoff attempts in!

- Bunting: Who, What, When, and Where
-
The Who, What, When, & Where of Bunting
Some teams bunt a lot, and if you’re not prepared, it could cost you valuable outs. The Bunting section in the Short Game tool allows you to analyze:
- Who bunts the most/least?
- What kind of bunts are they dropping?
- When in an AB/inning do they bunt most/least?
- Where on the field are the bunts being directed?
- Can The Catcher Throw?
-
A Catcher’s Throws
The Short Game tool’s Base-Running section will help you figure out if there are any advantages to running on a catcher in specific counts or certain base states. Plus, you can view all associated Synergy video of the throws.
Having all this historical data and video in one place will help you develop a better feel of if and when you want to attempt a steal.
- Pickoffs By Pitch Count
-
Pickoff Attempts
Have you looked at opposing pitchers’ pickoff attempts by count? If you haven’t, it could be the edge you need in the postseason to get the jump on opposing pitchers.
Scroll down to the Short Game tool’s Pickoff section to see which counts a pitcher has historically made pickoff attempts in!
Pitch Highlighter: Dominate With Data
The Pitch Highlighter tool (643 Synergy & TrackMan SYNC) provides coaches with interactive displays showing pitch location, balls in play, and contact quality*, helping coaches identify successful pitches and those that are hit hard.
Additionally, the tables provide interactive, Synergy-connect data that will help you streamline opponent scouting. The Pitch Description table offers detailed insights on each pitch type, including Spin Rate and Induced Vertical Break*. The Batted Ball Profile breaks down how different pitches perform in games, while the Plate Discipline table reveals hitter tendencies against various pitch types. Analyzing Whiff and Put-Away Percentages can further assist coaches in strategizing whether to rely on fastballs or breaking balls for getting outs. (*TrackMan SYNC only)
Below are a few suggested use cases for Pitch Highlighter while preparing for postseason play! 👇

Filter The Data For A Clearer View
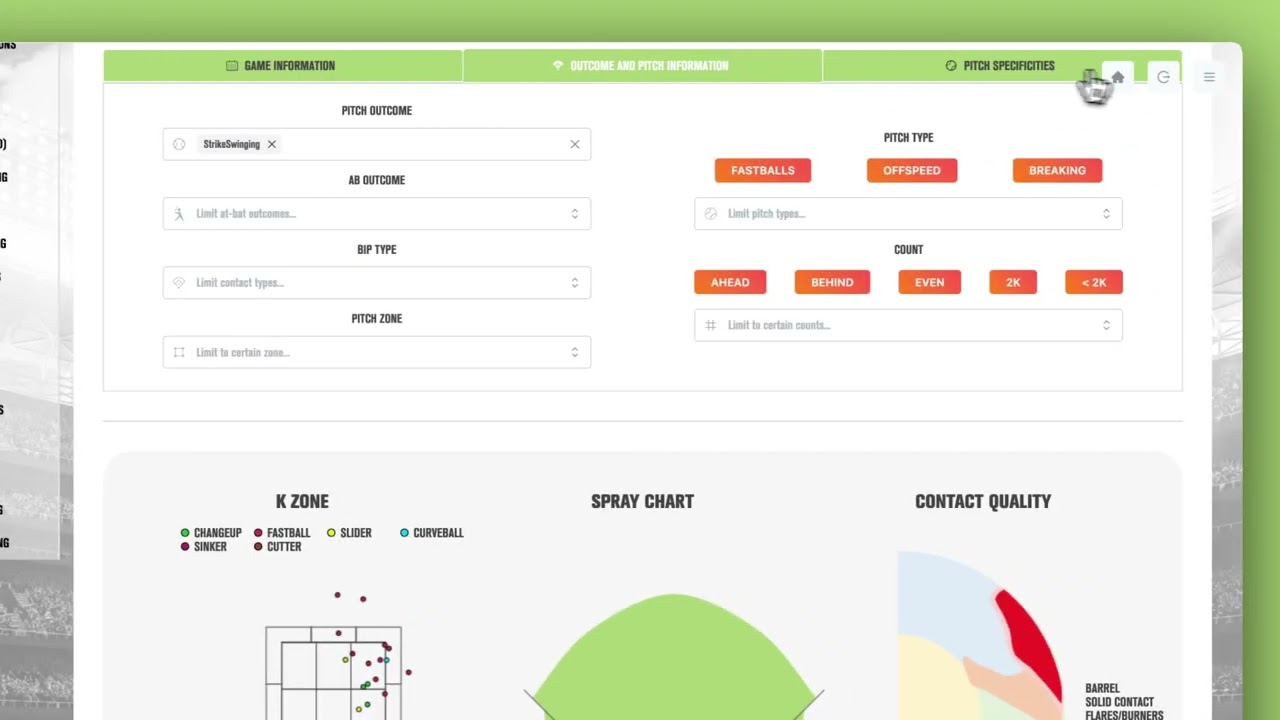
Sometimes, more data isn’t necessarily better, especially when you’re looking at Synergy-connected visualizations. That’s when our robust filtering options can be your friend.
Filters also allow you to clearly visualize a hunch you may have. Do you think a hitter struggles with velo up in the zone versus righties? Set the filters, see the data visualizations, and watch the associated Synergy video!
Connected Synergy Video
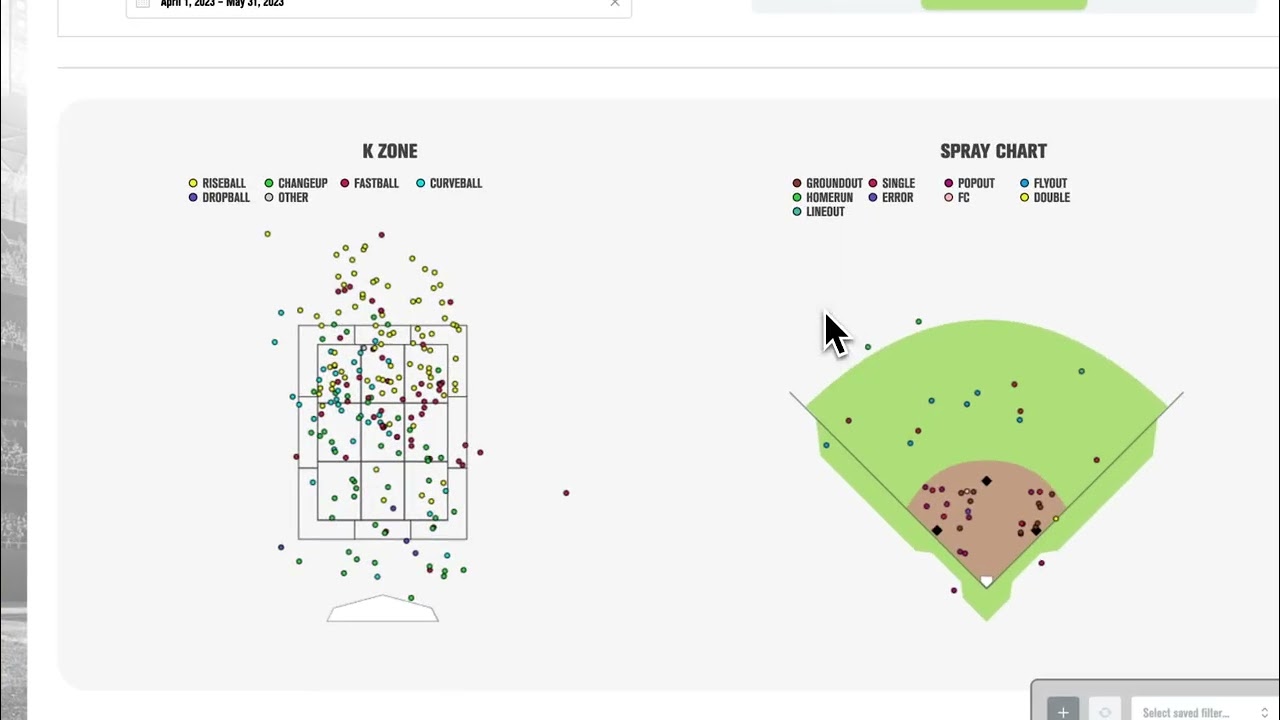
One of the main reasons the Pitch Highlighter tool is so helpful for scouting, particularly for the postseason, is that nearly every data point on the page is connected to associated Synergy video.
Click on any cell of the performance tables to watch the mapped Synergy video. Box-highlight the zone or field spray to watch Synergy video on all selected pitches.
Find Weaknesses In The Performance Tables
Head over to the Pitcher Highlighter performance tables to identify a hitter’s weaknesses by chase rates, take rates, and whiff rates by pitch type.
For faster evaluation, you can:
- Look for blue cells to see where the player struggles (compared to the D1 average).
- Look for red cells to see where the player excels (compared to the D1 average).
- Hover over the cell to see the D1 and MLB averages.
- And of course, click on the cell to watch all the associated Synergy video!

- Filter The Data
-
Filter The Data For A Clearer View
Sometimes, more data isn’t necessarily better, especially when you’re looking at Synergy-connected visualizations. That’s when our robust filtering options can be your friend.
Filters also allow you to clearly visualize a hunch you may have. Do you think a hitter struggles with velo up in the zone versus righties? Set the filters, see the data visualizations, and watch the associated Synergy video!
- All The Data, Connected To Video
-
Connected Synergy Video
One of the main reasons the Pitch Highlighter tool is so helpful for scouting, particularly for the postseason, is that nearly every data point on the page is connected to associated Synergy video.
Click on any cell of the performance tables to watch the mapped Synergy video. Box-highlight the zone or field spray to watch Synergy video on all selected pitches.
- Check The Data Tables To Find Weaknesses
-
Find Weaknesses In The Performance Tables
Head over to the Pitcher Highlighter performance tables to identify a hitter’s weaknesses by chase rates, take rates, and whiff rates by pitch type.
For faster evaluation, you can:
- Look for blue cells to see where the player struggles (compared to the D1 average).
- Look for red cells to see where the player excels (compared to the D1 average).
- Hover over the cell to see the D1 and MLB averages.
- And of course, click on the cell to watch all the associated Synergy video!
Weighted Heatmaps: Where The Damage Is Done
Weighted Heatmaps (found in the 643 Synergy tile) allow coaches and players to see not just where opponents hit the ball but where they create the most value. The red/blue visualization quickly identifies where pitchers should attack (blue areas) versus avoid (red areas) when facing specific hitters, providing more strategic value than traditional heatmaps.
When preparing for opponents, especially in a tournament setting, Weighted Heatmaps are an invaluable tool to easily communicate opponents’ strengths and weaknesses to players.
Below are a few suggested use cases for Weighted Heatmaps while preparing for postseason play! 👇

Comparing Weighted Heatmaps with Saved Filters (+ Matchup Filters)
Hopefully, you are already using the saved filters feature within the 643 platform, because with Comparative Heatmaps, the feature is super useful!
In the example here, we have two saved filters: “Behind In The Count” and “Ahead In The Count.” With these two filters applied to the comparative weighted heatmap tool, you can quickly see where damage is done in the zone overall, ahead in the count, and behind in the count.
Use this tool in the postseason to quickly evaluate opposing pitchers!

Weighted Heatmaps + Custom Reporting: A Great Game Day Combo
Adding Weighted Heatmaps to your game day opponent scouting reports is a great way to gather a lot of information on a player with a quick glance—perfect for pressure-packed postseason situations!
In the example here, the 16 weighted heatmaps are neatly organized into four columns: overall, 2K, vs LHH, and vs RHH, and four rows: overall, fastballs, breaking balls, and off-speed.

Matchup Heatmaps: 1v1 Heatmaps
Similar to the Run Value (Weighted) Heatmaps, Matchup Heatmaps are unique to the 6-4-3 Charts platform. Matchup Heatmaps are a simple and powerful tool that combines the Run Value (Weighted) Heatmaps for a specific hitter and pitcher to see how they matchup.
- Red indicates favorable outcomes for the hitter (hits/damage, balls, walks, etc.)
- Blue indicates favorable outcomes for the pitcher (outs, strikes, strikeouts, etc.)
(If you want to learn more about Run Value (Weighted) Heatmaps and Matchup Heatmaps, make sure to check out our introductory blog post.)

- Comparing Heatmaps
-
Comparing Weighted Heatmaps with Saved Filters (+ Matchup Filters)
Hopefully, you are already using the saved filters feature within the 643 platform, because with Comparative Heatmaps, the feature is super useful!
In the example here, we have two saved filters: “Behind In The Count” and “Ahead In The Count.” With these two filters applied to the comparative weighted heatmap tool, you can quickly see where damage is done in the zone overall, ahead in the count, and behind in the count.
Use this tool in the postseason to quickly evaluate opposing pitchers!
- Weighted Heatmaps + Custom Reporting
-
Weighted Heatmaps + Custom Reporting: A Great Game Day Combo
Adding Weighted Heatmaps to your game day opponent scouting reports is a great way to gather a lot of information on a player with a quick glance—perfect for pressure-packed postseason situations!
In the example here, the 16 weighted heatmaps are neatly organized into four columns: overall, 2K, vs LHH, and vs RHH, and four rows: overall, fastballs, breaking balls, and off-speed.
- Matchup Heatmaps
-
Matchup Heatmaps: 1v1 Heatmaps
Similar to the Run Value (Weighted) Heatmaps, Matchup Heatmaps are unique to the 6-4-3 Charts platform. Matchup Heatmaps are a simple and powerful tool that combines the Run Value (Weighted) Heatmaps for a specific hitter and pitcher to see how they matchup.
- Red indicates favorable outcomes for the hitter (hits/damage, balls, walks, etc.)
- Blue indicates favorable outcomes for the pitcher (outs, strikes, strikeouts, etc.)
(If you want to learn more about Run Value (Weighted) Heatmaps and Matchup Heatmaps, make sure to check out our introductory blog post.)
Custom Reporting: Exactly How You Want It
The Custom Reporting suite of tools is where coaches can make 643 truly theirs, especially around the postseason. Custom Reports allow you to take data from all your sources and integrate it into one, single-page report. Custom Tables let you create data tables with whatever data or configuration you’d like (and add them to custom reports). And the new Dashboards tool takes the Custom Reports you’ve already made and turns them into interactive, Synergy-connected scouting dashboards.
Below are a few suggested use cases for Custom Reports, Tables, and Dashboards while preparing for postseason play! 👇

Multi-Player, Single Page Reports
Add visuals and tables on multiple players to a single custom report page.
Why?
It makes scouting reports more skimmable for your players and dugout reports more manageable for your staff. This allows you to make faster decisions when it matters most this postseason!

Custom Tables For The Dugout
Instead of spending time before each game organizing columns in an Excel sheet exactly how you want them for a dugout chart, create a Custom Table in 643!
Custom Tables allow you to add 643, Synergy, or TrackMan data, however you’d like, to a custom table. Then, before each game, just export the table to hang in the dugout, add it to a custom report, or watch Synergy videos from it in Custom Dashboards!

Custom Dashboards
The ultimate tool for custom scouting efficiency! With Custom Dashboards, you can take the Custom Report templates you’ve already made and view associated Synergy video from the custom tables and visualizations in those reports.
Perfect for time-sensitive scouting sessions, where you only want to see the data you need and watch the tape that matters.

- Multi-Player, Single Page Reports
-
Multi-Player, Single Page Reports
Add visuals and tables on multiple players to a single custom report page.
Why?
It makes scouting reports more skimmable for your players and dugout reports more manageable for your staff. This allows you to make faster decisions when it matters most this postseason!
- Custom Tables For The Dugout
-
Custom Tables For The Dugout
Instead of spending time before each game organizing columns in an Excel sheet exactly how you want them for a dugout chart, create a Custom Table in 643!
Custom Tables allow you to add 643, Synergy, or TrackMan data, however you’d like, to a custom table. Then, before each game, just export the table to hang in the dugout, add it to a custom report, or watch Synergy videos from it in Custom Dashboards!
- Custom Dashboards
-
Custom Dashboards
The ultimate tool for custom scouting efficiency! With Custom Dashboards, you can take the Custom Report templates you’ve already made and view associated Synergy video from the custom tables and visualizations in those reports.
Perfect for time-sensitive scouting sessions, where you only want to see the data you need and watch the tape that matters.